Inference engineering · Lab 9
I measured speculative decoding on Llama 3.1 8B. I used five configurations and six batch sizes. The speed increase disappears at large batch sizes. The acceptance rate does not change. These two facts have one cause.
01 · Method
What I measured
Speculative decoding makes a cheap drafter write k candidate tokens. The large model then checks all k tokens in one forward pass.
The large model must read all of its weights for each forward pass. This read costs the same for 1 token and for 4 tokens. Therefore the extra tokens look free. This report shows when they stop being free.
I tested three drafters:
- Draft model. Llama 3.2 1B writes the draft tokens.
k = 3. - EAGLE-3. A small trained head writes the draft tokens.
k = 3. - N-gram. A text search of the prompt writes the draft tokens.
k = 8.
I tested three workloads:
- Chat prose. 40 general questions. Input length 53 tokens.
- Code completion. HumanEval function stubs. Input length 122 tokens.
- Code revision. HumanEval functions plus an instruction to add type hints. Input length 258 tokens.
Each run lasted 60 seconds. The harness kept a fixed number of requests in flight. It dropped the first 5 seconds and the last 3 seconds. It calculated system throughput over the activity window of the counted requests. It reported per-user throughput separately. Every configuration used the same random seed and the same prompt order.
02 · Result
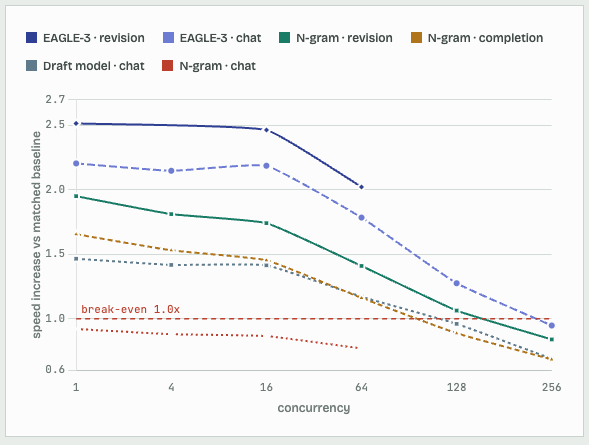
The speed increase disappears at large batch sizes
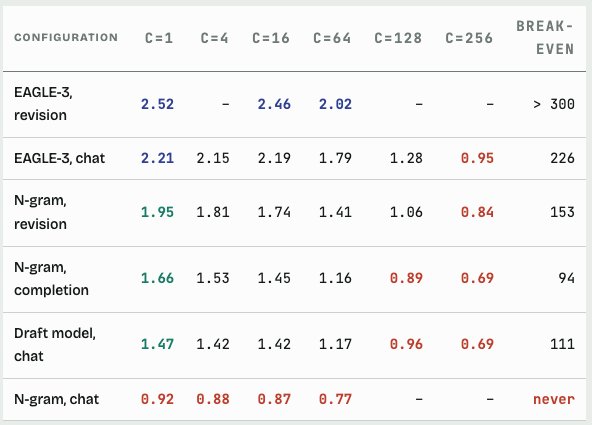
Every configuration crosses below 1.0. The crossing point moves with the drafter, but every configuration crosses.
Why the batch size controls this
During decode, the arithmetic intensity of the weight multiply equals the batch size. The H100 does about 990 dense BF16 TFLOPS. It reads memory at about 3.35 TB/s. Divide the first number by the second. The result is 295 FLOP per byte.
Therefore the GPU becomes compute-bound near 295 tokens for each forward pass. Speculation multiplies the tokens for each forward pass by k+1. The model predicts a crossing point near 295 divided by 4, which is 74.
The draft model crossed at 111. EAGLE-3 crossed at 226. The prediction is low for both. The prediction ignores the cost of drafting, and that cost differs by a factor of 5.4 between the two methods. Use this prediction as a floor, not as an exact answer.
03 · Result
The acceptance rate does not fall with batch size
This is the important result. Speculation quality stays constant. Only the cost of checking the draft tokens changes.
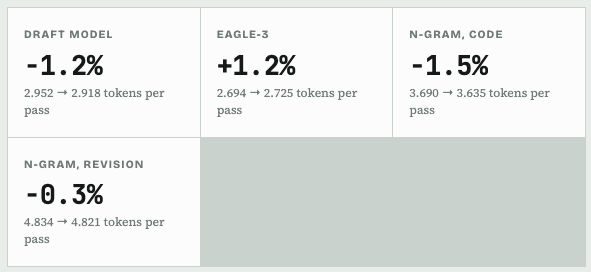
The batch size increased by a factor of 256. The mean acceptance length moved by less than 1.5 percent in all four cases. Four independent methods give the same answer.
Many engineers explain the large-batch collapse as a fall in acceptance. That explanation is wrong. The drafter predicts the same text as well at batch 256 as at batch 1. The GPU simply stops having spare compute to check the predictions.
04 · Result
Milliseconds for each token, not acceptance rate
EAGLE-3 accepts fewer tokens than the draft model. EAGLE-3 is 1.5 times faster.
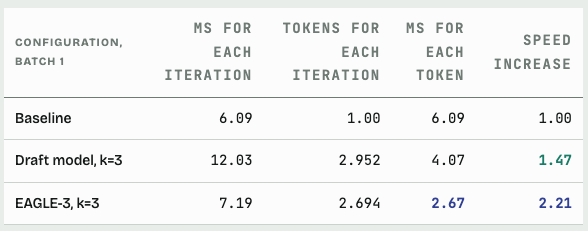
The draft model spends 5.94 ms on drafting for each iteration. That is 1.98 ms for each of its three forward passes. Llama 3.2 1B holds 2.5 GB of weights. At 3.35 TB/s a forward pass needs only 0.74 ms. Therefore the draft model runs at 37 percent of its memory limit.
A 1B model at batch 1 gives the GPU too little work for each kernel. Kernel launch cost then controls the time. EAGLE-3 removes this cost. It uses one small head, and that head reuses the hidden states of the target model. EAGLE-3 spends 0.37 ms for each draft position. That is 5.4 times less than the draft model.
The rule
Acceptance rate is only one of two inputs. The correct measure is milliseconds for each accepted token. A drafter that accepts less can still win, if it drafts more cheaply. EAGLE-3 gives up 9 percent of acceptance. It recovers 81 percent of the drafting cost.
05 · Result
N-gram cost is constant. N-gram benefit is not.
The three n-gram runs form a controlled experiment. The server config never changed. Only the input text changed.
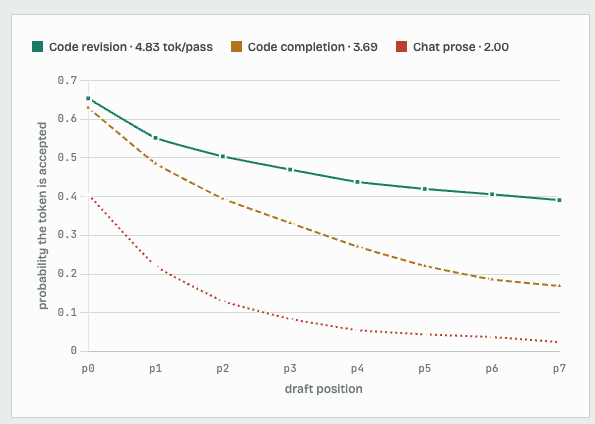
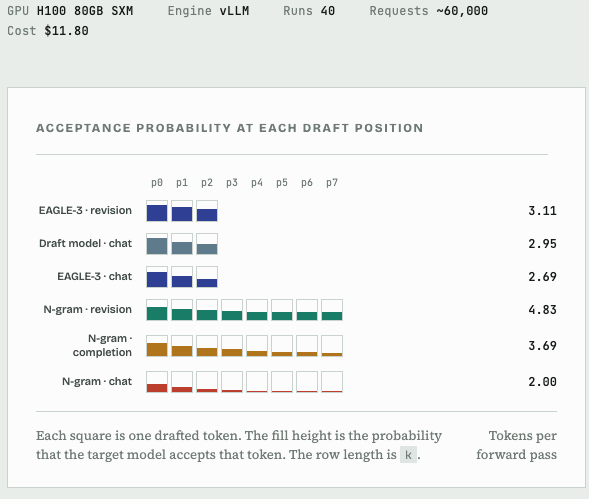
Probability that the target model accepts the draft token at each position. One rejection ends the whole tail, so the curve always falls.
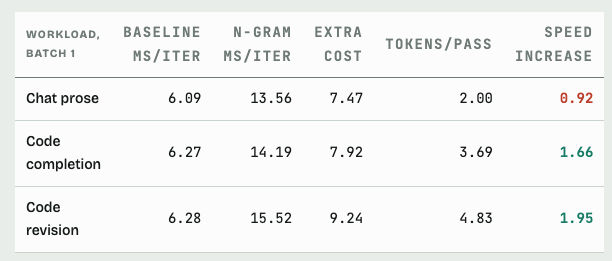
The extra cost changes by 24 percent. The tokens for each pass change by a factor of 2.4. The cost of speculation is almost constant. The return depends only on the traffic.
N-gram drafts 8 tokens on every iteration. I checked this: draft tokens divided by drafts equals 7.89, 7.93 and 7.94 across the three workloads. N-gram is not adaptive. It pays the full 9 times multiplier on every step, and it does this even when the text search finds a bad match.
This gives a usable threshold. At k = 8 and batch 1, break-even needs 13.56 divided by 6.09, which is 2.23 tokens for each pass. Chat prose returns 2.00. It loses by 10 percent. That is a near miss, not a large failure.
The draft position curve tells you how to set k
Chat prose falls to 6 percent of its first position by position 7. Positions 4 to 7 add 0.16 tokens and cost four check slots. k = 8 is much too large for chat prose. k = 2 would probably turn the loss into a small gain.
Code revision holds at 60 percent of its first position by position 7. The curve is still almost flat. k = 8 is too small for that workload. Log the per position vector in production. It reads out the correct k directly.
06 · Result
N-gram never wins, even on the workload built for it
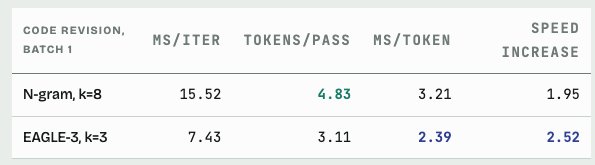
Code revision is the best case for text search. The output copies most of the input. EAGLE-3 still wins by 29 percent.
A result I did not predict
EAGLE-3 accepted more on the revision workload than on chat: 3.112 against 2.694. Every position improved. I treated predictable text as an n-gram advantage. It is not. Repetitive text is easier for any drafter. A trained head converts that predictability more efficiently than a text search does.
07 · Baseline
The baseline shows where the spare compute was
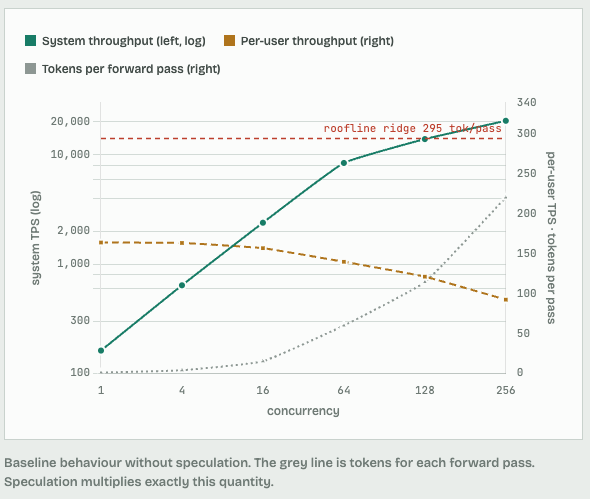
The baseline reached 6.09 ms for each token at batch 1. The weight read floor is 16.06 GB divided by 3.35 TB/s, which is 4.79 ms. The server therefore reached 79 percent of peak memory bandwidth. That is a correct configuration.
The baseline never reached its knee. At batch 256 it still returned 1.47 times the throughput for 2 times the concurrency. Tokens for each forward pass reached 221. The roofline ridge is 295. Spare compute remained, and speculation spends exactly that spare compute.
A check on the harness
Multiply system throughput by the inter-token latency. The result is the true batch occupancy. The baseline gives 0.98, 3.91, 15.2, 60.1, 114.6 and 220.9 against concurrencies of 1, 4, 16, 64, 128 and 256. Two independent measurements agree. Keep this check.
08 · Conclusions
What to do in production
- Use EAGLE-3 as the default. It won at every point on every workload. The draft model lost at every point. Do not use a separate draft model on an H100 when an EAGLE-3 head exists.
- Turn speculation off above the break-even concurrency. For EAGLE-3 here, that point is near 226. Measure it. Do not assume it.
- Do not run n-gram on general prose. It costs 8 to 23 percent. If you serve mixed traffic and enable n-gram globally, you tax the chat portion.
- Measure milliseconds for each accepted token. Acceptance rate alone selects the wrong configuration. It selected the wrong one twice in this lab.
- Log the per position acceptance vector. The scalar rate hides the shape. The shape tells you how to set
k.
One number is worth more than the batch-1 headline. EAGLE-3 at batch 128 returned 17,753 tokens each second at 150 tokens each second for each user. The baseline needed batch 256 to beat that throughput, and it then gave each user only 93 tokens each second. EAGLE-3 moves the whole curve. It does not trade one axis for the other.